Featured Infographics


Latest Infographics
Infographic
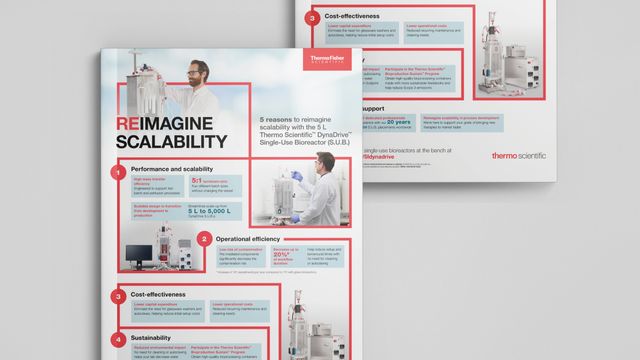
Rethink Scalability in Bioprocess Development
This infographic highlights how bench-scale single-use bioreactors help overcome these barriers with efficiency, flexibility and reduced environmental impact.
Infographic
Key Insights Shaping Biotech Today
This infographic highlights critical biotech trends and offers a snapshot of opportunities shaping the future of biologics and beyond.
Infographic
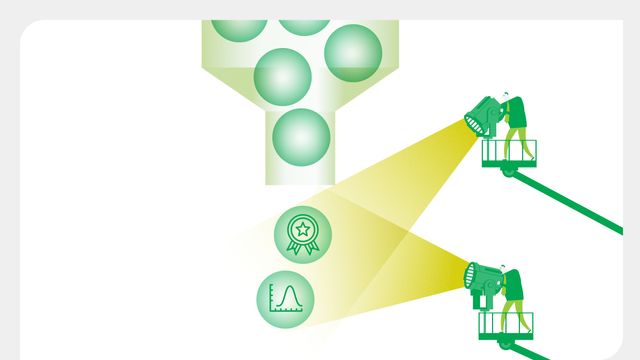
Flow Cytometry Staining Protocols for High-Quality Data
This infographic is your quick guide to troubleshooting staining protocols. Discover the high-performance products that when used with optimised staining protocols can shed light on your flow cytometry experiments.

Infographic
The Simple Path To Proteomics in Just Nine Steps
This infographic explores a workflow that can bring proteomics to any lab in nine easy steps. Discover how to run a proteomics workflow in a short timeframe, even without prior experience.
Infographic
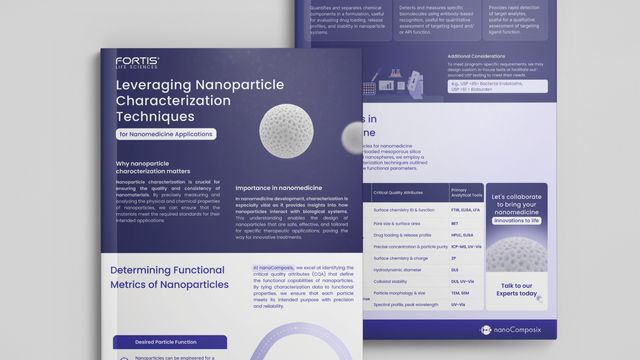
Optimize Nanomedicine With Better Particle Insight
This infographic explores the most effective techniques for analyzing nanoparticle properties, offering guidance on selecting the right tools for measuring critical quality attributes and improving design precision.

Infographic
Automating NGS Workflows
This infographic highlights how specialized automation modules can be implemented throughout NGS workflows – from thermal cycling to magnetic bead handling.

Infographic
Is My Food Full of PFAS?
This infographic highlights how PFAS enter the food chain, identifies the foods most affected and outlines the gaps in current regulations, providing essential insights for anyone concerned about what’s on their plate.

Infographic
The Science That Keeps Biofuels Flowing
This infographic explores how to apply the right analytical technique during multiple stages of bioethanol and biodiesel production.

Infographic
Is Your Lab Balance Built To Last?
This infographic highlights how modern lab balances are redefining environmental standards through material reuse, efficient energy use and end-of-life recyclability.
Infographic
Optimize Patient Outcomes With LC-MS in Therapeutic Drug Monitoring
This infographic explores how liquid chromatography–mass spectrometry (LC-MS) offers the precision, sensitivity and reliability needed to overcome these challenges in the clinical setting.
Advertisement